Hello Friends,
I hope you are doing well. In our previous articles we have learnt about what is stress, strain, types of stress and strain etc. In this article we are going to discuss about stress strain relationship and also learn about stress strain curve which is very important to predict any material behavior when it is subjected to load.
Let’s start with its definitions.
Stress is developed in any object when it is subjected to load. Mathematically it is the ratio of applied load to cross section area of the body. It is shown by σ and its unit is N/m2.

Strain is the measurement of deformation induced in the object when it is subjected to the load or stress. Mathematically it is equal to the ratio of change in dimension to original dimension. It is a unit less quantity and shown by ϵ.

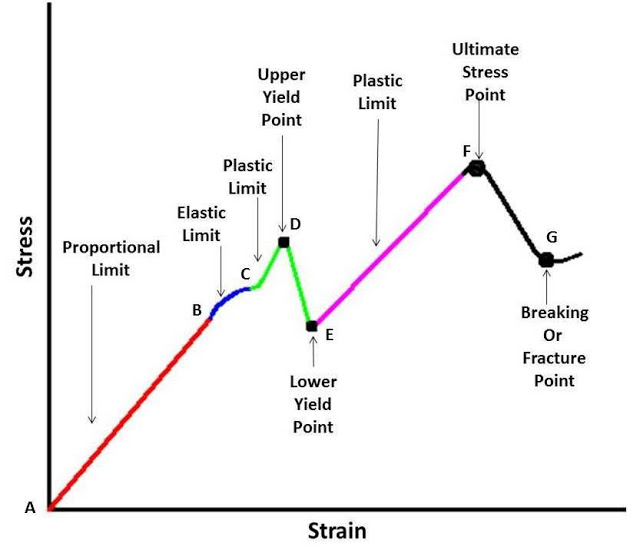
Stress Strain Curve:
This curve represent behavior of any material or object during loading condition. It is used to predict safe loading conditions, failure point, facture point etc. This diagram is very useful in design of any machine.
To plot this diagram, stress is plotted along the vertical axis and strain is plotted on horizontal axis. A specified dimension object and a universal loading machine are used to perform this experiment. An increasing load is applied by a universal loading machine on the object which induced stress as well as strain in the object. For every load, we get a different stress and strain value which is plotted on a graph with the help of a special designed computer. As we increase the load, we get a point where the object breaks into two parts. This is called fracture or failure point. We plot the curve at the end of this point.
The stress strain curve is different for ductile and brittle material. For ductile material it is given below.

Explanation of various point of stress strain curve for ductile material:
Proportional Limit:
As the name implies, in this region of stress strain curve, stress is directly proportional to strain. The ratio of stress to strain gives always a similar constant within this limit. This constant is known as Young Modulus of Elasticity. It is shown by AB in the diagram. The object gets its initial dimension after the load is removed within proportional limit.
Elastic Limit:
This limit is shown by AC in the diagram. This limit is a slighter upgrade version of proportional limit. It is combination of proportional limit AB and a slighter increase part BC in which stress is not directly proportional to the strain. It is called elastic limit because the object gets its initial dimensions when the load is removed. If we increase the load or stress beyond this limit, the object will not get its original dimensions ever at its own.
Yield Point:
When we increase the load beyond the point C, the object starts to deform permanently or it will never get back its initial dimensions. If we increases the load or stress continuously we reaches a point where the stress strain curve changes its slop and start to move in negative direction. This point is shown by D. The upper point at which it reaches without changing its slop is known as upper yield point. Beyond the upper yield point the object continuously and rapidly changes its dimension without changing the loading condition or decreasing the loading condition or stress. After reaching upper yield point there is no option to stop the deformation. The object continuously deform till it reaches another point which is called lower yield point. It is shown by the letter E in the curve. If we lower down the loading below lower yield point, the continuous deformation will stop.
Ultimate stress point:
If we continuously increase the load or stress on the object after reaching lower yield point, the strain or deformation in the object also increases. After a continuous loading we reaches a point after which it is impossible to get back the object without facture or failure. This point is known as ultimate stress point. It is shown by F. The strain in the object continuously increases after this point without increasing the loading as well as after decrease the loading. All the engineering application works under a safe limit which is calculated by this point.
Breaking point or fracture point:
After the ultimate stress point, there is no option to get back the object without fracture. The point in curve at which the object will fail or fractured is known as fracture or breaking point. It is shown by G in the curve.
This is all about stress strain curve. If you have any query regarding this article, ask by commenting. If you like this article, don’t forget to share it with your friends. Subscribe our website for more informative articles. Thanks for reading it.


why slope goes in negative after upper yeild point ???